(Original document: http://enzyme.ucd.ie)
Table of Contents
- Index
- What can you do with pKa calculations?
- Introduction
- Titratable groups and their importance in proteins
- Reaction mechanisms
- Protein stability
- The effect of the protein on an amino acid pKa value
- Theory
- Pitfalls and limitations
In short: pKa calculations tell you if the pKa value of a protein
titratable group differs significantly from the pKa value that this
group normally has in solution.
To know why this is important, it is useful to know a bit about
proteins and acid-base reactions.
One of the more frequent chemical reactions that
occur in
a protein-water solution is the uptake and release of protons by amino
acids. The parts of amino acids in a protein that can absorb or release
protons will be referred to as protein titratable groups. Thus an
Aspartic acid side chain contains a single titratable group (namely the
carboxy group: COO-), and an N-terminal Lysine contains two titratable
groups (the N-terminal amino group, and the amino group in the side
chain).
We will divide protein titratable groups into two categories: acids and
bases. We define acids as Asp, Glu, Cys, Ser, Tyr, Thr and the
C-terminal. Bases are the N-terminal, His, Lys and Arg.
The basic protein titratable groups are positively charged in their
protonated state, and the acidic protein titratable groups are neutral
in their protonated state.
Please note that this definition of acids and bases does not comply
with the correct chemical definition of acids and bases, since the
correct chemical definition as a base or acid is always assciated with
a specific reaction. In the example below HA is an acid in the reaction
with water, but in the reaction with BH, it acts as a base.
HA + H2O -> A- + H3O+
HA + BH -> H2A+ + B-
A protonation or deprotonation event is a chemical
reaction. And just like any other chemical reaction, the distribution
of molecules between the two states of the reaction reactions can be
described by an equilibrium constant.
For acids (HA), the reaction and the associated equilibrium constant is:
HA + H2O -> H3O+ + A-
The pKa values is simply -log(Ka). Similar K values exist for bases
(see section 4.1).
Therefore, if we know the pKa value for a protein titratable group,
then we can predict the charge present on this group if the protein is
in a solution with a given pH value, since pH=-log([H3O+]).
The pKa values of protein titratable groups in water have been
estimated by comparing with the pKa values for model compounds in water
(Table 2.1). One can therefore get a quite good estimate of the
protonation state of a protein simply by assuming that the pKa values
in the folded protein are the same as the estimated pKa values for the
protein titratable groups.
In some special situations it is necessary, however, to obtain a more
detailed picture of the pKa values of a protein. This is often the case
when studying enzymatic mechanism and protein stability, and in these
cases pKa calculation techniques provide a way of calculating the
effect of the protein environment on the pKa values of the titratable
groups in the protein.
| Titratable group |
Estimated pKa value |
|
N-term
|
8.0
|
|
C-term
|
3.0
|
|
Asp
|
4.0
|
|
Glu
|
4.3
|
|
Cys
|
8.7
|
|
Tyr
|
9.8
|
|
Ser
|
14.2
|
|
Thr
|
15.0
|
|
Arg
|
13
|
|
Lys
|
10.5
|
|
His (0 -> + transition)
|
6.4
|
Table 2.1. Estimates of acid
dissociation constants for amino acid residues in a polypeptide.
From: Jack Kyte, Structure in Protein Chemistry, Garland Publishing,
Inc. 1995
In recent years pKa calculations have improved
significantly, and the best pKa calculation algorihtms reach and rmsd
between predicted and experimentally measured pKa values of 0.50 -
0.75. It is important to stress that this correlation is for a quite
limited test set of approximately 120 pKa values in a limited set of
proteins, and that most of the experimentally pKa values differ very
little from the pKa values listed in Table 2.1.
pKa calculation algorithms are thus relatively good at predicting the
pKa values that aren't that different from their model pKa value.
Normally it is not that interesting to calculate essentially normal pKa
values, and most applications of pKa calculation algorithms focus on
calculating pKa values for "special" residues in active sites that have
highly shifted pKa values. Only a handful of highly shifted pKa values
have been measured experimentally, and it is therefore not straight
forward to assess the accuracy of pKa calculation routines in
calculating these, but as a rule of thumb one can assume that
calculated pKa values are accurate within 1.25 pKa units.
It is important, however, to critically examine the structure around
residues that are predicted to have highly shifted pKa values. Bumps
(too short inter-atomic distances) or other structural artifacts
(crystal-induced salt bridges, the presence of ion etc.) can cause pKa
calculation programs to predict large shifts in pKa values that aren't
observed in real life.
You need:
- An X-ray structure or a homology built model
of your target protein
- Charge and radius parameters for all special
ligands in the protein
- A computer and some patience
pKa calculation theory: First look in this
document, then read the following articles:
Running a pKa calculation: Read section 6, and if it still
doesn't work, then mail Jens.Nielsen@ucd.ie
or come see me in the Conway Building Room F050.
When to trust a pKa calculation:
- Nielsen
JE, McCammon JA
On the evaluation and optimization of protein X-ray structures for pKa
calculations
Protein Sci 2003 Feb;12(2):313-26
Top of document
Top of document
This section describes the general equations for
acid-base reactions and the basic theory behind pKa calculations.
The
dissociation of a proton from an acid
generally takes the form
HA + H2O -> H3O+
+ A- (Eq. 4.1)
The
free energy change for this reaction
(DGa)
can be related to an equilibrium constant (Ka)
for the reaction (we exclude water and replace H3O+
with H+ for simplicity):
 (Eq.
4.2) (Eq.
4.2)
 (Eq.
4.3) (Eq.
4.3)
For
acid-base reactions it is customary
to report the pKa values, which is simply -log(Ka).
The
Henderson-Hasselbalch equation is a rearrangement of equation 4.3:
 (Eq.
4.4) (Eq.
4.4)
 (Eq.
4.5) (Eq.
4.5)
From
Eq. 4.4 it is seen that the pKa
value of an acid is the pH value where the concentrations of the
protonated and
deprotonated forms of the acid are present at the exact same
concentrations.
Furthermore by rearranging Eq. 4.4:
 (Eq. 4.6) (Eq. 4.6)
and
plotting fHA as a function
of pH we get the well-known sigmoid titration curve (Fig. 4.1)
Figure 4.1. The titration of an
acid with a pKa value of 5.0 calculated using Eq. 4.6
For
the association of a proton with a
base, a similar set of equations can be produced. The major difference
being
that the base reaction is:
B + H3O+ -> BH+
+ H2O (Eq. 4.7)
The
corresponding equilibrium constant
thus becomes (water excluded for simplicity)
 (Eq.
4.8) (Eq.
4.8)
It is
seen that the major difference
between equations 4.8 and 4.3 is that the concentration of [H+]
is
in the denominator in Eq. 4.8 and in the numerator in Eq. 4.3. This
means that
equations 4.4 and 4.6 need to be rearranged for bases to take this into
account. This
is left to the enthusiastic reader.
Every
residue in a protein is, in
principle, a titratable group. In the following we will limit ourselves
to
looking only at the titration of those groups that have pKa values in
water
within the range 0-14. We are thus left with the titratable groups in
the side
chains of Asp, Glu, Tyr, Cys, His (only the transition from His+
to His0), Lys and Arg as well as the two terminal groups.
For reasons of simplicity we will refer to Asp, Glu, Cys, Tyr and the
C-terminus as acids, and to His, Arg, Lys and the N-terminus as bases.
Please
note that the correct definition of acids and bases always is connected
with a
specific reaction. The definitions we use here thus represent nothing
more than
a convenient way of dividing the titratable residues in proteins into
two
groups.
The pKa
value of a titratable group is a
measure of the free energy difference between the neutral and charged
state of
the group. It is therefore possible to calculate the pKa value of a
group if we
can calculate the free energy difference between the charged and
neutral state
of that group in the protein. The calculation of this energy difference
is
performed in three steps:
1.
Calculation
of the desolvation energy associated with moving the
neutral and charged form of the group from water to its position in the
protein
(Often called the Born energy).
2.
The
interaction energy of the neutral and charged form of the
residue with the permanent dipoles of the protein (The so-called
background
interaction energy).
3.
The
calculation of the pair wise interaction energy between the
titratable groups. For groups that are far apart the interaction energy
is
calculated only for the situation where both groups are in their
charged form
(the charged-charged interaction energy). For groups that are close
together,
both the charged-charged, charged-neutral, neutral-charged and
neutral-neutral
interaction energies are calculated. The cut-off for determining
whether two
groups are close or far apart is normally set so that the
charged-neutral,
neutral-charged and neutral-neutral interaction energies are
insignificant
compared to the charged-charged interaction energy. This happens when
the
charged-charged interaction energy is less than 1kT.
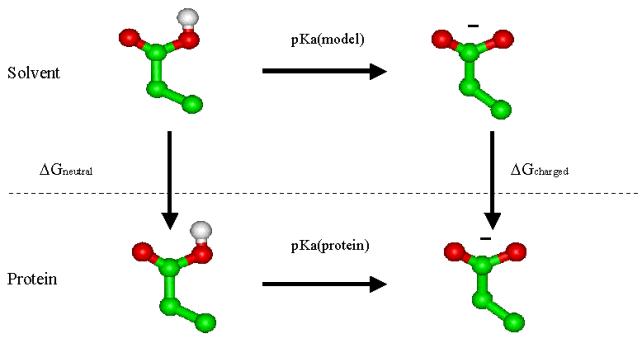
Figure 4.2
The thermodynamic cycle for the transfer of a titratable group from
water to a
protein environment. pKa(model) is the model pKa value of the group in
water.
pKa(protein) is the pKa value of the group in the protein, disregarding
the
effects from other titratable groups, and DGcharged
and DGneutral
are the energies associated with transferring the charged and neutral
form from
water into the protein.
Term
1 above is independent of all the
other titratable groups, and term 2 describes the interaction with all
other
titratable groups. We now define a quantity called the intrinsic pKa as
the pKa
that each residue would have if all other titratable groups in the
protein were
kept fixed in their neutral state. We can calculate this pKa by using
the
thermodynamic cycle depicted in Fig 4.2. In the figure pKa(model) is
the pKa
value for the residue in water (see Table 6.1) whereas the pKa(protein)
is the
intrinsic pKa. The DGneutral
and DGcharged
values are the sums
of the desolvation energy and the background interaction energy for the
neutral
and charged form of the residue respectively.
To
calculate the true pKa of the residue
in the protein, we need only to account for the effect of the
interaction with
the rest of the titratable groups in the protein.
The desolvation
energies and the
background interaction energies can be regarded as being largely
pH-independent. The interaction energy between titratable groups is
obviously
not pH-independent, and it is therefore not possible just to add the
interaction energies with all the other titratable groups to the
intrinsic pKa
in order to get the true pKa value of the residue. We therefore have to
use a
calculation protocol that takes the pH-dependence of the interactions
between
titratable groups into account. This can be done if we calculate the
energy for
each of the possible protonation states of the protein, and use these
energies
to evaluate the partition function for these states at a range of
pH-values.
|
State
|
Group 1
|
Group 2
|
Group 3
|
Energy
|
|
1
|
+
|
+
|
+
|
dGpH(1) + dGpH(2) + dGpH(3)
+ (1=2) + (1=3) + (2=3)
|
|
2
|
+
|
+
|
0
|
dGpH(1) + dGpH(2) + (1=2)
|
|
3
|
+
|
0
|
+
|
dGpH(1) + dGpH(3) + (1=3)
|
|
4
|
+
|
0
|
0
|
dGpH(1)
|
|
5
|
0
|
+
|
+
|
dGpH(2) + dGpH(3) + (2=3)
|
|
6
|
0
|
+
|
0
|
dGpH(2)
|
|
7
|
0
|
0
|
+
|
dGpH(3)
|
|
8
|
0
|
0
|
0
|
0
|
Table 4.1
Possible protonation states for a hypothetical protein consisting of
three
titratable group. +: charged, 0: neutral. Energy is relative to state
8.
(X=Y) indicates the interaction energy between the charged forms of
groups X and Y. dGpH (X) is the free energy
difference between the charged and neutral forms of group X at a fixed
pH value
(see text for explanation).
Let us consider a
protein with three
titratable groups. Each of these groups can exist in two states:
charged and
neutral. The protein can thus occupy 23 different
protonation
states. These are summarised in Table 4.1.At a given pH we want to
determine
the free energy of all the states in Table 4.1 relative to the free
energy of
state 8, which we have defined to be zero. The free energy of each of
the other
states consists of two terms A and B:
A)
For each residue: the energy
difference between the charged and
neutral form of the residue disregarding the interactions between the
titratable groups.
B)
The interactions between the
titratable groups.
4.4.1 Term A
Term
A can be
calculated from the intrinsic pKa for each residue by rearranging Eq.
4.10:
 (Eq.
4.15) (Eq.
4.15)
and
remembering
that
 (Eq.
4.16) (Eq.
4.16)
This
gives an
expression for the free energy difference between the charged and
neutral state
of a titratable group at a fixed pH value:
 (Eq.
4.17) (Eq.
4.17)
4.4.2 Term B
Term B is the
interaction energies
between the titratable groups in this particular protonation state. For
state
five, for example, term B should hold the following three interaction
energies
([X : Y] denotes the interaction energy between X and Y):
E1: [G1:0 :
G2:+] - [G1:0 : G2:0]
E2: [G1:0 :
G3:+] - [G1:0 : G3:0]
E3: [G2:+ : G3:+] - [G2:0 :
G3:0]
(G1 = Group 1, G2 =
Group 2, G3 = Group
3, :+ = charged, :0 = neutral)
The
energies E1
and E2 are already contained in the intrinsic pKa, because it is
calculated by
determining the energy of charging a single group in a form of the
protein
where all other titratable groups are in their neutral state (see
section 4.2.3
and Fig. 6.2).
Thus
only E3 has
to be added to term A to obtain the free energy for state five. The
intrinsic
pKa, however, does also contain the energies E4 and E5 (in the same way
that
the intrinsic pKa contains E1 and E2).
E4: [G2 (+) : G3 (0)]
- [G2 (0) : G3 (0)]
E5: [G2 (0) : G3 (+)]
- [G2 (0) : G3 (0)]
We have to correct for
this in the energy
that we add to the intrinsic pKa [DGpH(2)
and DGpH(3) in Table 4.1] for the
interaction between the charged forms of groups two and three. A simple
evaluation shows that:
E3
- (E4 + E5) =
[G2(+) : G3 (+)] - [G2 (+) : G3 (0)] - [G2 (0) : G3 (+)]
+ [G2 (0) : G3 (0)]
and
this is
therefore the energy which is listed as (2<<3)
in Table 4.1.
We now know the energy
of every possible
protonation state of a protein at a given pH value, and the
next step is the conversion of these
energies into fractional charges at each pH value for each residue in
order to
get the titration curves.
A straight-forward way
to find the
occupancy of the different states in Table 4.1 is to evaluate the
Boltzmann sum
for each state.
 (Eq.
4.18) (Eq.
4.18)
Here pi is
the fraction of
molecules in state i. Ei is the energy of state i, and the
sum in
the denominator is over all possible states of the system. k is
Boltzmann's
constant and T is the temperature in Kelvin.
The fractional charge
of a particular
group is simply the sum of the pi's for all the states where
the
group is charged. Thus for group 1 in Table 4.1, for example, the
charge is the
sum of p1, p2, p3 and p4.
It is clear from Table
4.1 that the
number of states equals 2N, where N is the number of
titratable
groups. For values of N significantly larger than 30, it is therefore
no longer
possible to evaluate (Eq. 4.18). For large systems it is thus customary
to use
a Monte Carlo protocol [Beroza et al., 1991] to obtain pi.
From the calculated
titration curves the
pKa value for each group is determined as the pH where the group is
half-protonated. This gives an accurate result only if the titration
curve
follows a Henderson-Hasselbalch shape. This is the case for most
groups, but
especially in active sites it is quite common to find groups that have
very
irregular titration curves. In these cases manual inspection of the
titration
curves is necessary in order to obtain meaningful results.
Several pKa calculation
packages are
presently available. Most of these, however, have serious trouble to
reach a
better agreement with experimentally determined pKa values than the
so-called
null model. The null model assumes that the pKa values of protein side
chains
are not shifted at all compared to their value in water.
This poor performance
of pKa calculations
is not due to an incorrect theory, though, but rather to an incorrect
description of the protein in the calculations. A fundamental problem
with pKa
calculations is that crystal structures are used as source of
coordinates for
the protein. The crystal symmetry induces structural changes in the
protein,
and thereby causes some pKa values to be shifted compared to their
value in
solution. It is therefore not surprising that the pKa values calculated
from a
crystal structure will differ from the pKa values measured in solution
by NMR.
The description of the protein used in
pKa calculations is, however, also often to simple. Protons are, for
example,
often omitted, and methods that include protons do often not model the
deprotonation of a titratable group explicitly. It is our opinion that
pKa
calculations can improve greatly by including a more detailed
description of
the protein and its dynamics.
Top of document
What pKa calculations can do:
What pKa calculation can't do:
So as with all other tools in computational biology
pKa
calculations can help you with where to start looking. Do not put too
much faith in them, and always use common sense when
interpreting the results. If something seems really
unlikely then it probably is.
Common sense will almost always give you the best description of the
situation.
The pKa calculations will in principle be most
accurate if the structure of your protein is exactly the structure it
will have at the conditions where you want to know the pKa value.
In practice this is almost never possible since X-ray structures are
slightly perturbed by the crystal environment, and because of this
there is a good chance that the calculated pKa values will be less
accurate for residues that are involved in crystal contacts.
Top of document
|